Overview
TopTeam supports various Requirements Modeling Language (RML) Diagram Types. RML approaches software from the perspectives of business analysis and product management, focusing on specifying needs. Instead of focusing intensely on complex system design models, RML looks at a project’s goals and objectives. It then uses the models to break down these objectives into requirements, which are easily understood by both business stakeholders and developers.
By focusing on objectives instead of system design, RML enables teams to maximize the value of their projects.
As part of its Diagram suite, TopTeam has introduced 12 RML Diagram Types.
Who should read this?
- TopTeam Users
|
Action |
Help link |
|
Business Data Diagram |
Business Data Diagram (BDD) is an RML data model that defines a business data structure. BDDs focus on how data is thought of in a business and relationships between data objects. For more information on BDD, refer to Business Data Diagrams. |
|
Business Objective Model |
Business Objective Model (BOM) documents a project’s value for the company creating it. BOM consists of business problem/objective pairs that lead to a product concept as a solution to a business problem. For more information on BOM, refer to Business Objective Models. |
|
Data Flow Diagram |
Data Flow Diagram (DFD) is a visual representation of how data changes or is used in a process. DFD is an RML data model that shows the flow of information through systems, data stores, and actors. For more information on DFD, refer to Data Flow Diagrams. |
|
Decision Tree |
Decision Tree is a visual representation of complex logical statements. It is an RML systems model that allows you to easily view logic and analyze decisions. For more information on Decision Trees, refer to Decision Trees. |
|
Ecosystem Map |
Ecosystem Map shows systems interaction and their nature of relationships. Using this RML systems model, you can visualize and analyze all of the systems. For more information on Ecosystem Maps, refer to Ecosystem Maps. |
|
Key Performance Indicator Model |
Key Performance Indicator Models (KPIM) contain Key Performance Indicators (KPI). KPI is a metric that is used to quantify the success of a process step or action. These KPIs are added to process steps to help add priority information around the requirements. For more information on KPI Models, refer to KPI Models. |
|
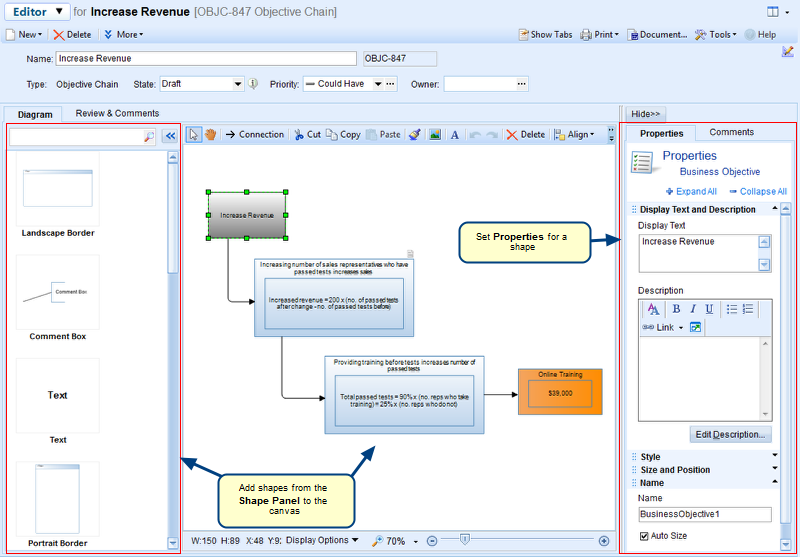
Objective Chain |
Objective Chain, as the name suggests, is a chain of business objectives. It begins with business objectives and eventually ends with features. For more information on Objective Chains, refer to Objective Chains. |
|
Organization Charts |
An Organization (Org) Chart is a hierarchical structure of organizational group names, roles or individual persons represented by boxes and reporting relationships between them represented by lines. For more information on Org Charts, refer to Org Charts. |
|
Process Flows |
Process Flows indicate all possible paths that a process can follow. Process Flows have process steps that are connected by directional arrows. For more information on Process Flows, refer to Process Flows. |
|
State Diagrams |
State Diagrams are data models that show the changes between states of business data objects in the system. For more information on State Diagrams, refer to State Diagrams. |
|
System Flows |
System Flows are system models that show interaction between different systems and complex branching. They show different activities and decisions that systems execute. For more information on System Flows, refer to System Flows. |
|
User Interface Flows |
User Interface (UI) Flows show graphically how a user can navigate between different pages of a user interface. For more information on UI Flows, refer to UI Flows. |
|
Generic Diagrams |
Generic Diagrams include all the shapes of the above-listed templates. This diagram type is specific to TopTeam. |
Revised: June 22nd, 2017